
COMPARATIVE STUDY OF THE EFFECTS OF THE MICROWAVE RADIATION NEUTRALIZERS ON THE PHYSIOLOGICAL STATE OF HUMAN SUBJECTS
INTRODUCTION
This research was conducted at Elsys Corp. in St. Petersburg, Russia. It was designed to investigate whether microwave (MW) radiation of mobile phone can induce changes in the human's physiological state. This research included the testing of MRET-Shield (United States Patent No. 6,369,399 B1) and three other competitive neutralizers: made in Japan (JP), made in Russia (RU), and made in Taiwan (TW), in order to determine their effects as protective devices against MW radiation negative physiological effects. MW effects were studied on mobile phone Nokia, model 3310 operating in the frequency range of 895-917MHz, with power output in the range of 0.002-2W, and SAR value less than 5.4mW/kg. Tested human subjects were controlled by Genius Video Cam Web (V1) connected with NB Samsung P30 (1.6GHz). The light illumination of each tested subject was set at the level of 500Lx.
MRET-Shield is made of polar polymer dielectric material and does not change the power of MW signals transmitted to the mobile phone. The low frequency patterns generated by defined polar polymer compound are superimposed on MW signals, they interact with bio-structures and support and improve cellular functions in the body. Other neutralizers are made of materials with high magnetic permeability (TW made of high density copper, JP made of ferromagnetic compound, RU made of silicon plate with incorporated metallic lines) in order to reduce the power of transmitted MW signals.
METHODS
The changes in the physiological state, which indicated the response to the stress, were measured by the method of Vibraimage technology (RU 2187904, WO 02/51154). This technology allows visualization and fixation of the micro-movements of points on the surface of the human body (face) by means of video camera and Vibraimage software. It also measures integral characteristics of macro and micro-vibrations of points on the surface of the body. Integral characteristics include the Distribution of Amplitudes ("AM" mode, the characteristic of human body macro-vibrations) and the Distribution of Frequencies ("FM" mode, the characteristic of human body micro-vibrations). They are presented in the form of histograms. The micro-vibrations of the human body are correlated with the physiological state of the human subject.
The research was conducted on 10 human subjects. The Vibraimage parameters were measured one minute before and one minute after their exposure to the mobile phone in talk mode. The exposure to the mobile phone in each test was during 5 minutes. Five tests were conducted on each subject: exposure to the mobile phone without any neutralizer, consequent exposures to the same mobile phone with MRET-Shield, TW, JP, and RU neutralizers. During the "blind" testing procedure all subjects were kept in comfortable environment. During the process of exposure to the mobile phone in talk mode each tested subject was verbally "counting" the same row of figures in order to maintain the relaxed physiological state.
THE Distribution of Frequencies is the most informative integral characteristic of human body micro-vibrations. It shows the values and the range of frequencies of human body micro-vibrations as well as the percentage rate of each frequency in the distribution. There is direct correlation between stress reactions of the body and the changes in the parameters of the Distribution of Frequencies. The state of excitation in the body is signified by higher values and enlarged range of frequencies. The state of exhaustion in the body is signified by lower values and narrower range of frequencies.
CORRESPONDENCE BETWEEN VIBRAIMAGE COLOR SCALE AND PHYSIOLOGICAL STATE OF HUMAN BODY
The comparison of VibraImage method of measurement of the human body frequencies with EEG testing methodology shows direct correlation between the brain waves and the body micro-vibration frequencies. In compliance with the physiological state of the human subject the brain waves have four ranges: Beta, Alpha, Theta, and Delta.
Brain Wave Ranges: |
VibraImage Color Scale: |
 |
Yellow, orange, red |
 |
Green, light blue |
 |
Blue |
 |
Deep blue, purple |
 |
Purple |
The human body frequencies measured by VibraImage method can be placed in the corresponding ranges:
| Physiological State |
Brain Waves, Hz |
Body Vibrations, Hz |
Body Vibrations, relat. units |
| Sleep/Exhausted | 1.5 - 5 (Delta) | 0.3 - 1.0 | 15 - 51 |
| Drowsy/Tired | 5 - 9 (Theta) | 1.0 - 1.8 | 51 - 92 |
| Relaxed | 9 - 15 (Alpha) | 1.8 - 3.0 | 92 - 153 |
| Excited/Working | 15 - 40 (Beta) | 3.0 - 8.0 | 153 - 408 |
In VibraImage system the micro-vibration frequencies are identified with the following colors:
Color |
Range in related units |
| Purple | 0 - 30 |
| Deep Blue | 30 - 80 |
| Light Blue | 80 - 120 |
| Green | 120 - 180 |
| Yellow | 180 - 220 |
| Red | 220 - 255 |
Thus, in VibraImage system the relaxed state of the human subject is identified by green and light blue color, the drowsy/tired state by blue color, the exhausted state by deep blue and purple colors, and the excited state by yellow and red colors.
The slower brain waves have the higher amplitudes. Beta waves have the smallest amplitudes and Delta waves have the highest amplitudes. The same regularity characterizes the micro-vibrations of the body. The slower micro vibrations have the higher amplitudes.
EXAMPLES OF VIBRAIMAGE SYSTEM IMAGES AND HISTOGRAMS ACQUIRED DURING THE TESTING PROCEDURE
 |
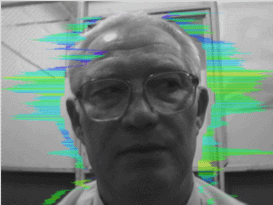 |
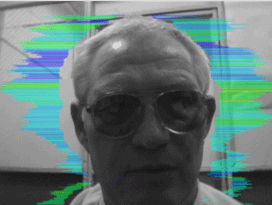
Fig.1 The image of a subject in "FM" mode before and after 5 minutes exposure of the human subject to the mobile phone radiation in talk mode without neutralizer.
 |
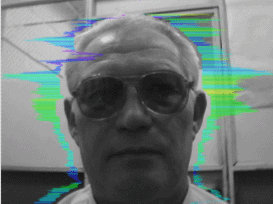 |
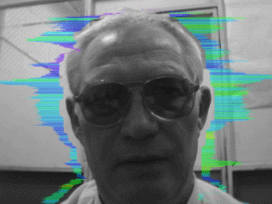
Fig.2 The image of a subject in "FM" mode before and after 5 minutes exposure of the human subject to the mobile radiation in talk mode with MRET-Shield.
The images on Fig.1 show substantial alterations in the form of Vibraimage color spectrum after the exposure of the human subject to the mobile phone radiation without any neutralizer. They show the increase of yellow and green areas in this spectrum, which identifies the increase of frequency values. This fact is confirmed by the substantial level of changes in the form of histograms on Fig.3. These histograms show the substantial increase of the mean values of frequencies and the increase of the percentage rate of the higher frequency values in the Frequency Distribution after the exposure of the human subject to the mobile phone.
The images on Fig.2 show insignificant alterations in the form of Vibraimage color spectrum after the exposure to the mobile phone with MRET-Shield. They show the slight increase of yellow and green color areas in this spectrum, which identifies the slight increase of frequency values. This fact is confirmed by the very slight level of changes in the form of histograms on Fig.4, comparing to the level of changes on Fig.3 for the mobile phone without MRET-Shield installation. The histograms on Fig.4 show the non substantial increase of the mean values of frequencies and the insignificant increase of percentage rate of the higher frequency values in the Distribution after the exposure of the human subject to the mobile phone with MRET-Shield.
The histograms on Fig.3 through Fig.7 below show the difference in the Frequency Distributions of human body vibrations before and after the exposure of the human subject to the mobile phone radiation in talk mode. It is possible to notice on Fig.4 that the installation of MRET-Shield on the mobile phone makes the difference almost indistinguishable.
The histograms of the Frequency Distributions before and after the exposure of the human subject to the mobile phone radiation without any neutralizer (Fig.3) and with three other neutralizers except MRET-Shield (Fig.5, Fig.6, Fig.7) show substantial changes in the Frequency Distributions.
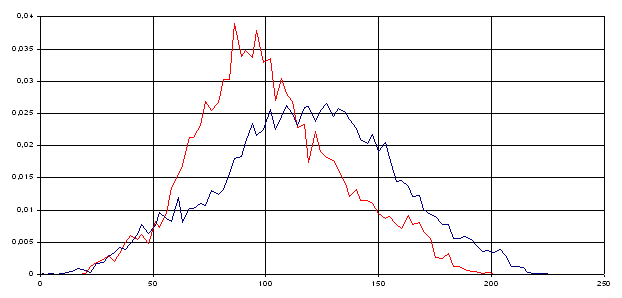
Fig. 3 "FM" mode: the histograms of human body Frequency Distribution before (red diagram) and after (blue diagram) 5 minutes exposure to the mobile phone in talk mode without any neutralizer.
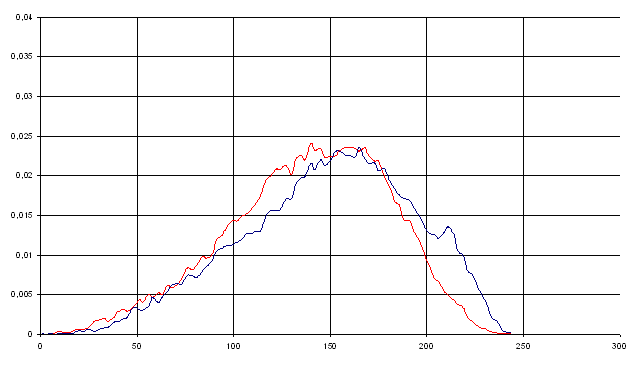
Fig.4 "FM" mode: the histograms of human body Frequency Distribution before (red diagram) and after (blue diagram) 5 minutes exposure to the mobile phone in talk mode with MRET-Shield
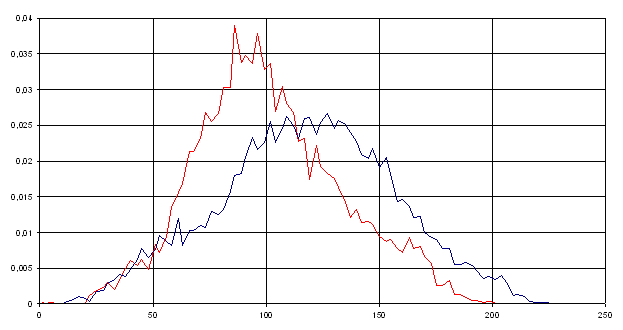
Fig.5 "FM" mode: the histograms of human body Frequency Distribution before (red diagram) and after (blue diagram) 5 minutes exposure to the mobile phone in talk mode with Japanese (JP) neutralizer.
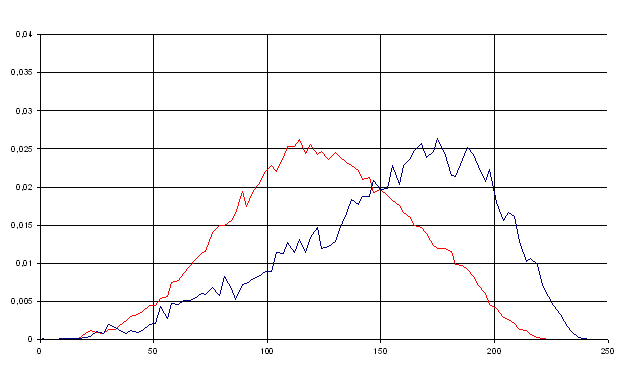
Fig.6 "FM" mode: the histograms of human body Frequency Distribution before (red diagram) and after (blue diagram) 5 minutes exposure to the mobile phone in talk mode with Taiwanese (TW) neutralizer.
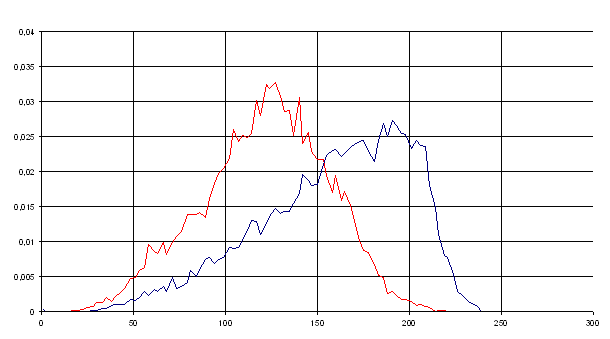
Fig.7 "FM" mode: the histograms of human body Frequency Distribution before (red diagram) and after (blue diagram) 5 minutes exposure to the mobile phone in talk mode with Russian (RU) neutralizer.
RESULTS
The main parameters of the Frequency Distribution are the mean value of frequencies M and the mean squire deviation D. The most informative parameter is the Mean Value of Frequencies M; the mean squire deviation D has direct correlation with the Width of Frequency Range. During the testing procedure parameters M and D were measured first in normal state of human subject before the exposure to the phone (control MC, DC) and then following the 5 minutes exposure to the mobile phone in talk mode. The mobile phone was tested without any neutralizers, with MRET-Shield and with three other neutralizers respectfully. The measured parameters M and D were normalized by their values in normal state MC, DC. After that the normalized changes in parameters (after and before the exposure of the human subject to the phone in talk mode) were calculated for experiments on mobile phone with and without neutralizers.
ΔMVF = │M/Mc - 1│ - |
normalized changes of the Mean Value of Frequencies of the human body micro-vibrations following the exposure to the mobile phone in talk mode; |
ΔWFR = │D/DC - 1│ - |
normalized changes of the Mean Value of Frequencies of the human body micro-vibrations following the exposure to the mobile phone in talk mode; |
THE CHANGES IN THE PARAMETERS OF FREQUENCY DISTRIBUTION INDUCED BY EXPOSURE OF HUMAN SUBJECTS TO MOBILE PHONE RADIATION
The duration of exposure to MW from mobile phone with and without neutralizers was 5 minutes in all experiments. Comparing to the exposure to the mobile phone without any neutralizers, only MRET-Shield significantly reduced the level of changes of the Mean Values of Frequencies and of the Widths of Frequency Range, and consequently the level of changes of physiological state of human body. All other tested neutralizers, on the contrary, increased these changes. The results are presented in Table 1, Table 1A, Table 2, Table 2A, Fig.8, and Fig.9.
The horizontal axis on Fig.8 and Fig.9 (ΔMVF = 0 and ΔWFR = 0) correspond to the distribution of frequencies in normal state before the exposure to the mobile phone in talk mode (control). ΔMVF > 0 and ΔWFR > 0 correspond to the distribution of frequencies in stress situation of excitation or exhaustion. The excitation is characterized by the increase of the Mean Value of Frequencies (M/MC > 1) and the enlargement of the Frequency Range (D/DC > 1). The exhaustion is characterized by the decrease of Values of Frequencies (M/MC < 1) and the narrowing of Frequency Range (D/DC < 1).
| Table 1 |
|
||||
|
|||||
NO NEUTRALIZER |
MRET |
JP |
TW |
RU |
|
1st subject |
|||||
before the talk |
100.81 | 79.49 | 69.32 | 67.90 | 53.68 |
after the talk |
106.33 | 87.65 | 83.44 | 92.37 | 79.78 |
2nd subject |
|||||
before the talk |
64.8 | 77.00 | 66.80 | 77.60 | 68.30 |
after the talk |
70.00 | 78.00 | 84.10 | 64.80 | 58.40 |
3rd subject |
|||||
before the talk |
99.10 | 80.60 | 95.40 | 98.90 | 96.20 |
after the talk |
106.70 | 86.80 | 84.60 | 106.90 | 95.50 |
4th subject |
|||||
before the talk |
129.82 | 138.75 | 126.34 | 122.63 | 124.23 |
after the talk |
121.40 | 134.76 | 116.00 | 122.93 | 138.41 |
5th subject |
|||||
before the talk |
149.66 | 138.37 | 101.22 | 123.30 | 121.37 |
after the talk |
173.40 | 148.74 | 117.79 | 153.25 | 159.18 |
6th subject |
|||||
before the talk |
108.20 | 103.80 | 103.50 | 116.40 | 109.30 |
after the talk |
95.90 | 100.34 | 101.10 | 110.80 | 104.60 |
7th subject |
|||||
before the talk |
92.80 | 98.70 | 91.60 | 101.10 | 105.10 |
after the talk |
110.60 | 90.60 | 105.40 | 98.60 | 100.90 |
8th subject |
|||||
before the talk |
90.40 | 99.10 | 105.70 | 111.90 | 92.50 |
after the talk |
100.00 | 89.20 | 86.40 | 107.10 | 99.30 |
9th subject |
|||||
before the talk |
128.27 | 117.45 | 120.16 | 124.10 | 123.21 |
after the talk |
135.59 | 117.86 | 132.70 | 130.95 | 123.85 |
10th subject |
|||||
before the talk |
99.80 | 102.20 | 101.80 | 114.10 | 106.70 |
after the talk |
87.40 | 97.60 | 101.10 | 110.50 | 104.30 |
| Table 1A |
|
||||
|
|||||
NO NEUTRALIZER |
MRET |
JP |
TW |
RU |
|
1st subject |
5.48 | 10.26 | 20.37 | 36.04 | 48.62 |
2nd subject |
8.02 | 1.30 | 25.90 | 16.49 | 14.49 |
3rd subject |
7.67 | 7.69 | 11.32 | 8.09 | 0.73 |
4th subject |
6.49 | 2.88 | 8.18 | 0.24 | 11.41 |
5th subject |
15.86 | 7.49 | 16.37 | 24.29 | 31.15 |
6th subject |
11.37 | 3.33 | 2.31 | 4.81 | 4.30 |
7th subject |
19.18 | 8.21 | 15.06 | 2.47 | 4.00 |
8th subject |
10.62 | 9.99 | 18.26 | 4.29 | 7.35 |
9th subject |
5.71 | 0.35 | 10.44 | 5.52 | 0.52 |
10th subject |
12.42 | 50 | 0.69 | 3.16 | 2.25 |
Mean Value of ΔMVF |
10.28 |
5.60 |
12.89 |
10.54 |
12.48 |
Mean Values of ΔMVF Calculated for 10 Tested Subjects
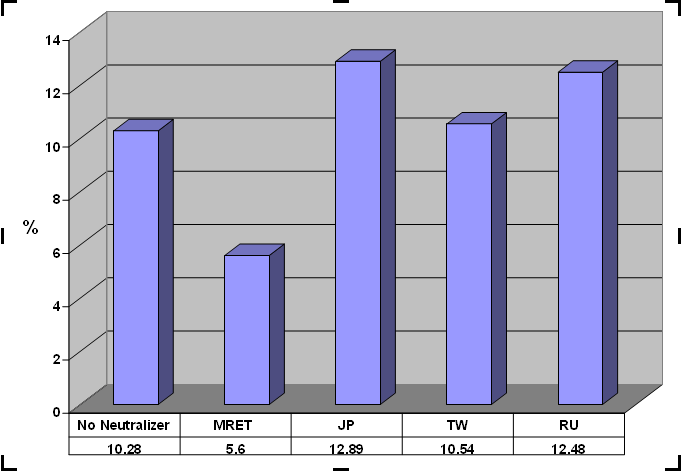
Fig.8 Normalized changes of the Mean Value of Frequencies of the human body micro vibrations following the 5 minutes exposure to the mobile phone radiation with and without MW radiation protective devices (neutralizers).
Fig.8 shows that the exposure to the mobile phone induced 10.3% average level of changes in the Mean Values of Frequencies. Comparing to the exposure to mobile phone without any neutralizer, only MRET-Shield significantly reduced the level of changes of the Mean Value of Frequencies. MRET-Shield reduced the average level of changes by 46% (from 10.3% to 5.6%). All other neutralizers, on the contrary, increased the level changes by up to 25%. The results are statistically significant (p<0.001). Fig.8 shows that the exposure to the mobile phone induced 10.3% average level of changes in the Mean Values of Frequencies. Comparing to the exposure to mobile phone without any neutralizer, only MRET-Shield significantly reduced the level of changes of the Mean Value of Frequencies. MRET-Shield reduced the average level of changes by 46% (from 10.3% to 5.6%). All other neutralizers, on the contrary, increased the level changes by up to 25%. The results are statistically significant (p<0.001).
| Table 2 |
|
||||
|
|||||
NO NEUTRALIZER |
MRET |
JP |
TW |
RU |
|
1st subject |
|||||
before the talk |
53.29 | 33.79 | 31.68 | 31.80 | 28.23 |
after the talk |
60.11 | 37.89 | 40.21 | 44.59 | 36.87 |
2nd subject |
|||||
before the talk |
58.50 | 75.00 | 75.00 | 79.80 | 66.60 |
after the talk |
65.00 | 71.00 | 83.90 | 60.40 | 62.00 |
3rd subject |
|||||
before the talk |
90.50 | 80.90 | 73.80 | 81.00 | 95.00 |
after the talk |
99.60 | 83.80 | 82.40 | 62.20 | 83.50 |
4th subject |
|||||
before the talk |
40.45 | 39.65 | 37.64 | 39.27 | 42.50 |
after the talk |
41.24 | 37.82 | 41.81 | 42.79 | 41.10 |
5th subject |
|||||
before the talk |
36.73 | 41.44 | 32.25 | 38.56 | 34.28 |
after the talk |
40.08 | 43.98 | 38.82 | 43.56 | 40.93 |
6th subject |
|||||
before the talk |
74.4 | 76.90 | 73.40 | 79.00 | 73.30 |
after the talk |
65.00 | 81.10 | 67.90 | 84.20 | 81.00 |
7th subject |
|||||
before the talk |
89.50 | 75.10 | 90.70 | 69.30 | 77.90 |
after the talk |
79.60 | 74.60 | 84.10 | 75.30 | 96.70 |
8th subject |
|||||
before the talk |
90.10 | 94.70 | 102.70 | 84.40 | 98.60 |
after the talk |
90.20 | 89.70 | 90.60 | 68.80 | 93.00 |
9th subject |
|||||
before the talk |
42.18 | 41.21 | 37.81 | 36.25 | 41.13 |
after the talk |
42.78 | 37.53 | 40.83 | 39.81 | 40.05 |
10th subject |
|||||
before the talk |
68.70 | 72.10 | 76.50 | 77.40 | 83.40 |
after the talk |
61.00 | 82.10 | 69.22 | 73.10 | 72.60 |
| Table 2A |
|
||||
|
|||||
NO NEUTRALIZER |
MRET |
JP |
TW |
RU |
|
1st subject |
12.80 | 12.13 | 26.93 | 40.22 | 30.61 |
2nd subject |
11.11 | 5.33 | 16.37 | 24.31 | 6.91 |
3rd subject |
10.06 | 3.58 | 11.65 | 23.21 | 12.10 |
4th subject |
1.95 | 4.62 | 11.08 | 8.96 | 3.29 |
5th subject |
9.12 | 6.13 | 20.37 | 12.97 | 19.40 |
6th subject |
12.63 | 5.46 | 7.49 | 6.58 | 9.91 |
7th subject |
11.06 | 0.67 | 7.28 | 8.66 | 24.13 |
8th subject |
0.11 | 5.28 | 11.78 | 18.48 | 5.68 |
9th subject |
1.42 | 8.93 | 7.99 | 9.82 | 2.63 |
10th subject |
11.21 | 13.87 | 9.52 | 5.56 | 12.95 |
Mean Value of ΔWFR |
9.24 |
6.14 |
13.05 |
15.88 |
12.77 |
Mean Values of ΔWFR Calculated for 10 Tested Subjects
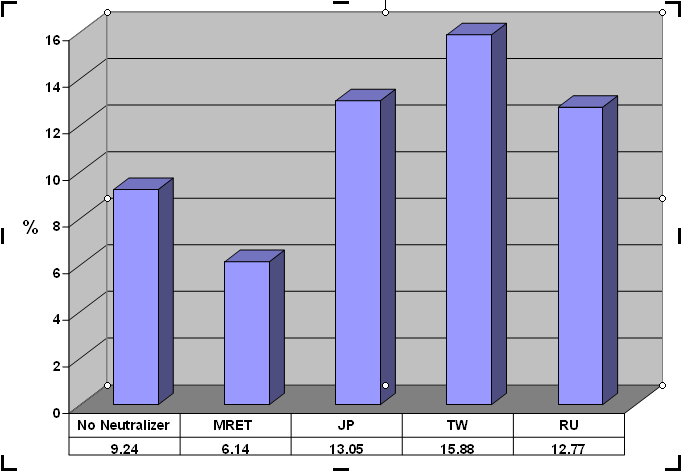
Fig.9 Normalized changes of the Width of Frequency Range of the human body micro vibrations following the 5 minutes exposure of human body to the mobile phone radiation with and without MW radiation protective devices (neutralizers).
Fig.9 shows that the exposure to the mobile phone induced 9.2% average level of changes in the Width of Frequency Range. Comparing to the exposure to the mobile phone without any neutralizers, only MRET-Shield significantly reduced the level of changes of the Width of the Frequency Range. MRET-Shield reduced the average level of changes by 34%. All other neutralizers, on the contrary, increased those changes by up to 73%. The results are statistically significant (p<0.001).
STATISTICAL VALUES OF THE RESULTS
Statistical calculations were based on the regular assumption of Normal Distribution of all studied mean values of ΔMVF and ΔWFR. The standard deviations of studied mean values are in the range of 1.06% to 3.25% (for mobile phone with MRET-Shield the standard deviation of the mean value of ΔMVF is 1.06%, for the mobile phone with TW neutralizer the standard deviation of the mean value of ΔWFR is 3.25%). The mean values differ from their control values (ΔMVFC=0, ΔWFRC=0) by more than standard deviation multiplied by 3 times. It means that all studied normalized changes in the parameters of the Distributions of Frequencies are statistically significant with p< 0.001.
The level of spontaneous fluctuations in studied Vibraimage parameters due to the spontaneous changes in the psycho-physiological state of tested subjects was registered at the level of 5%. The comparison of studied mean values of ΔMVF and ΔWFR with their spontaneous fluctuations level of 5% instead of the control level of 0% gives the following results.
For the mobile phone with MRET-Shield the difference between the mean values of Vibraimage parameters and their spontaneous fluctuations level of 5% is statistically insignificant with p>>0.05. For example, the mean value of ΔMVF is M(ΔMVF)=5.6%, its standard deviation σ(ΔMVF)=1.06%, M(ΔMVF)-5%=0.6%=0.57σ(ΔMVF). Consequently the p-level is p=0.3 and it is much higher than p=0.05. Thus, the installation of MRET-Shield on mobile phone makes the level of changes in studied parameters statistically insignificant because their p-levels are much higher than p=0.05.
For the mobile phone without any neutralizer and with all other studied neutralizers the difference between the mean values of Vibraimage parameters and their spontaneous fluctuations level of 5% is still statistically significant with p<0.001. All those mean values differ from their spontaneous fluctuations level of 5% by more than the standard deviation multiplied by 3 times and consequently their p-levels are less than p=0.001.
CONCLUSIONS
- This research shows that there are statistically significant changes in the physiological state of the human subjects after the 5 minutes exposure to the mobile phone radiation in talk mode.
- The installation of MRET-Shield on the mobile phone significantly reduces the level of changes in the physiological state of the human subjects and makes them insignificant.
- The installation of all other tested neutralizers on the mobile phone, on the contrary, increases the level of changes in the physiological state of the human subjects.

© 2001-2008 ELSYS Corp.

